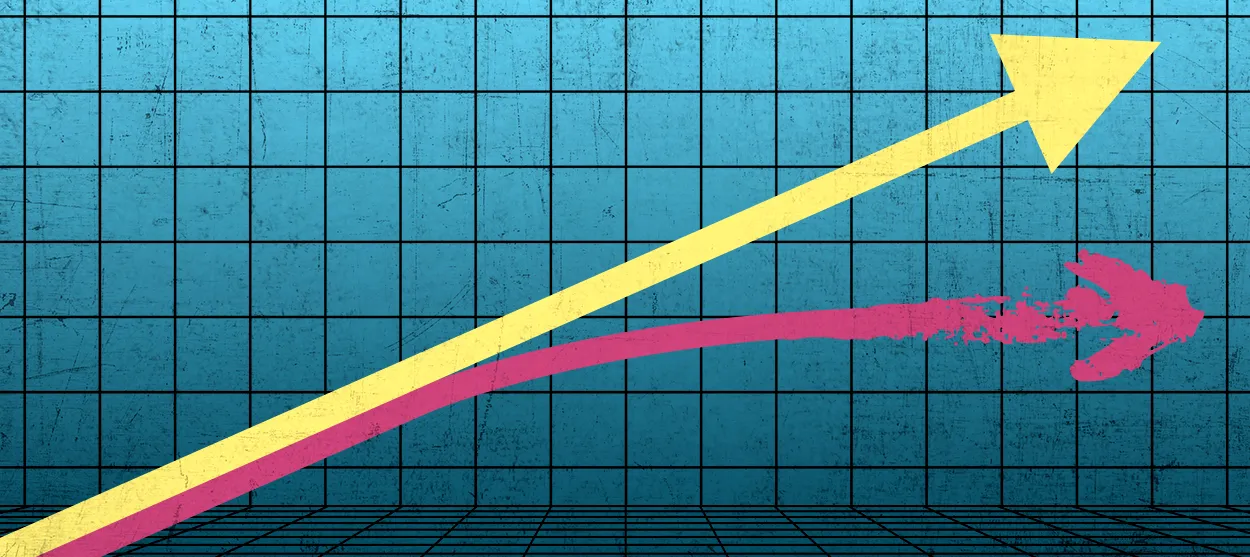

A well-known factoid in American economic debates is that wages used to grow with productivity, but they don't anymore. There's a particularly famous chart, courtesy of the Economic Policy Institute, that shows hourly pay for the typical U.S. household increasing closely in line with the economy's overall productivity from 1950 to 1970. Then wage growth suddenly slows down around 1972, and flatlines thereafter.
But there's another chart everyone should take note of as well. This one comes from Dean Baker and the Center for Economic and Policy Research, and it shows how the minimum wage tracked with productivity growth.
The story is essentially the same: For the first few decades after the minimum wage's creation in 1938, it grew in line with productivity. Then in 1968, the minimum wage stopped growing in inflation-adjusted terms, and started falling. "If the minimum wage did rise in step with productivity growth since 1968 it would be over $24 an hour today," Baker writes.
The Week
Escape your echo chamber. Get the facts behind the news, plus analysis from multiple perspectives.

Sign up for The Week's Free Newsletters
From our morning news briefing to a weekly Good News Newsletter, get the best of The Week delivered directly to your inbox.
From our morning news briefing to a weekly Good News Newsletter, get the best of The Week delivered directly to your inbox.
Productivity growth is really just companies learning how to do more with less; how to bring in more revenue while paying less for inputs. That wage growth kept pace with productivity growth in the middle of the century suggests that workers were sharing in that success — that the additional revenue created by productivity improvements wasn't just hoovered up by shareholders and CEOs, but was distributed out to the workers who made it happen, via higher paychecks.

When wages stopped growing but productivity kept sailing upward, that meant workers weren’t getting their cut anymore. Indeed, inequality started taking off just a few years after the minimum wage stopped rising in real terms and overall wages diverged from productivity.
That the minimum wage was also tracking with productivity growth over this time period — and especially the fact that the minimum wage broke off from productivity just a few years before overall wages did — suggests that aggressive minimum wage hikes were a big part of why workers once shared in their companies' success. It's important to remember that the minimum wage was never designed to rise automatically: Congress had to choose to increase it — and Congress had to choose to let the minimum wage deteriorate after 1968.

We know wages for the lowest-paid workers have risen faster in the last year or two than wages for more privileged workers. But we also know a big reason for that is the sudden wave of minimum wage hikes recently passed by various city and state legislatures. And we have plenty of evidence that minimum wage increases don't just benefit the workers directly affected by the policy, they also benefit workers already paid more than the minimum, because the rising wage floor tends to shift firms' entire pay schedules.
Wage inequality and stagnation have of course been a big topic in U.S. politics for a while now. But very often, experts and commentators and lawmakers insist the answer to the problem lies in market-friendly fixes.
For instance, when lawmakers suggest getting more Americans into higher education as a solution to low and stagnant pay, they're assuming that markets are already efficient — i.e. already paying Americans what their labor is worth — and the only way to raise pay is to make workers more productive. When I write about the importance of full employment, it is, to an extent, a market argument: to keep wages up, we need to keep demand for workers higher than the supply of workers. And, of course, a big reason a lot of technocrats prefer the Earned Income Tax Credit (EITC) over the minimum wage is that the EITC subsidizes wages after the fact, rather than interfere with businesses' pay decisions — because again, technocrats assume markets are already efficient, and forcing businesses to pay people more will make those businesses less productive.
The mainstream has been reluctant to adopt minimum wage hikes, and the pressure to do so has had to come from bottom-up activism, precisely because the minimum wage is very much not a "market-friendly" fix. It's a direct order from the government, imposed upon employers, that they may not pay their employees less than the specified hourly wage, no matter what "the market" is telling them.
Reluctance to embrace unions, to pass laws that could revitalize them, or to expand their reach through policies like sectoral bargaining, all rest on similar biases: Unions are a bunch of people haggling in a room, based on a process with rules laid down by government, as opposed to an impersonal market force setting prices. Indeed, the basic point of unions is to take the democratic political process that creates the minimum wage, and extend it into the interior decision-making of individual companies. It's the displacement of market processes by democratic processes. And it’s probably no accident that the collapse of unions preceded the collapse of the minimum wage — the loss of the former destroyed a lot of the political power to push increases in the latter.
Why haven't market-friendly fixes by themselves been sufficient? Partially it's because they rely on the assumption that the economy naturally and rapidly returns to full employment after a recession, which is what delivers the efficient market outcomes in the standard models. Beyond that, the real world just doesn't cooperate with simple economic models, even under the best of circumstances: Looking for a job is logistically hard; people have communities they don't want to leave; moving can be costly; and businesses with resources can always eat the costs of being picky about their hires a lot more than workers can eat the costs of being picky about the jobs they take.
Of course, this whole distinction between markets and not-markets is rather spurious: Markets wouldn't even exist without things like property rights and contract law, both of which are enforced by government, just like the minimum wage is. It's just that we're so used to those things we come to view them as "natural," rather than just another form of government "intervention." Nor does this mean the "market friendly" fixes aren’t worthwhile. Full employment provides an extra backstop for workers' bargaining power, and the political assault on full employment greatly sped up the decline of unions. Similarly, there are good arguments for the EITC as a compliment to the minimum wage, rather than as a replacement.
But one lesson of these two charts is that, if U.S. lawmakers want to get back to broadly shared prosperity, they need to get a lot more comfortable with market-unfriendly fixes.
Want more essential commentary and analysis like this delivered straight to your inbox? Sign up for The Week's "Today's best articles" newsletter here.


-
 Has Zohran Mamdani shown the Democrats how to win again?
Today’s Big Question New York City mayoral election touted as victory for left-wing populists but moderate centrist wins elsewhere present more complex path for Democratic Party
-
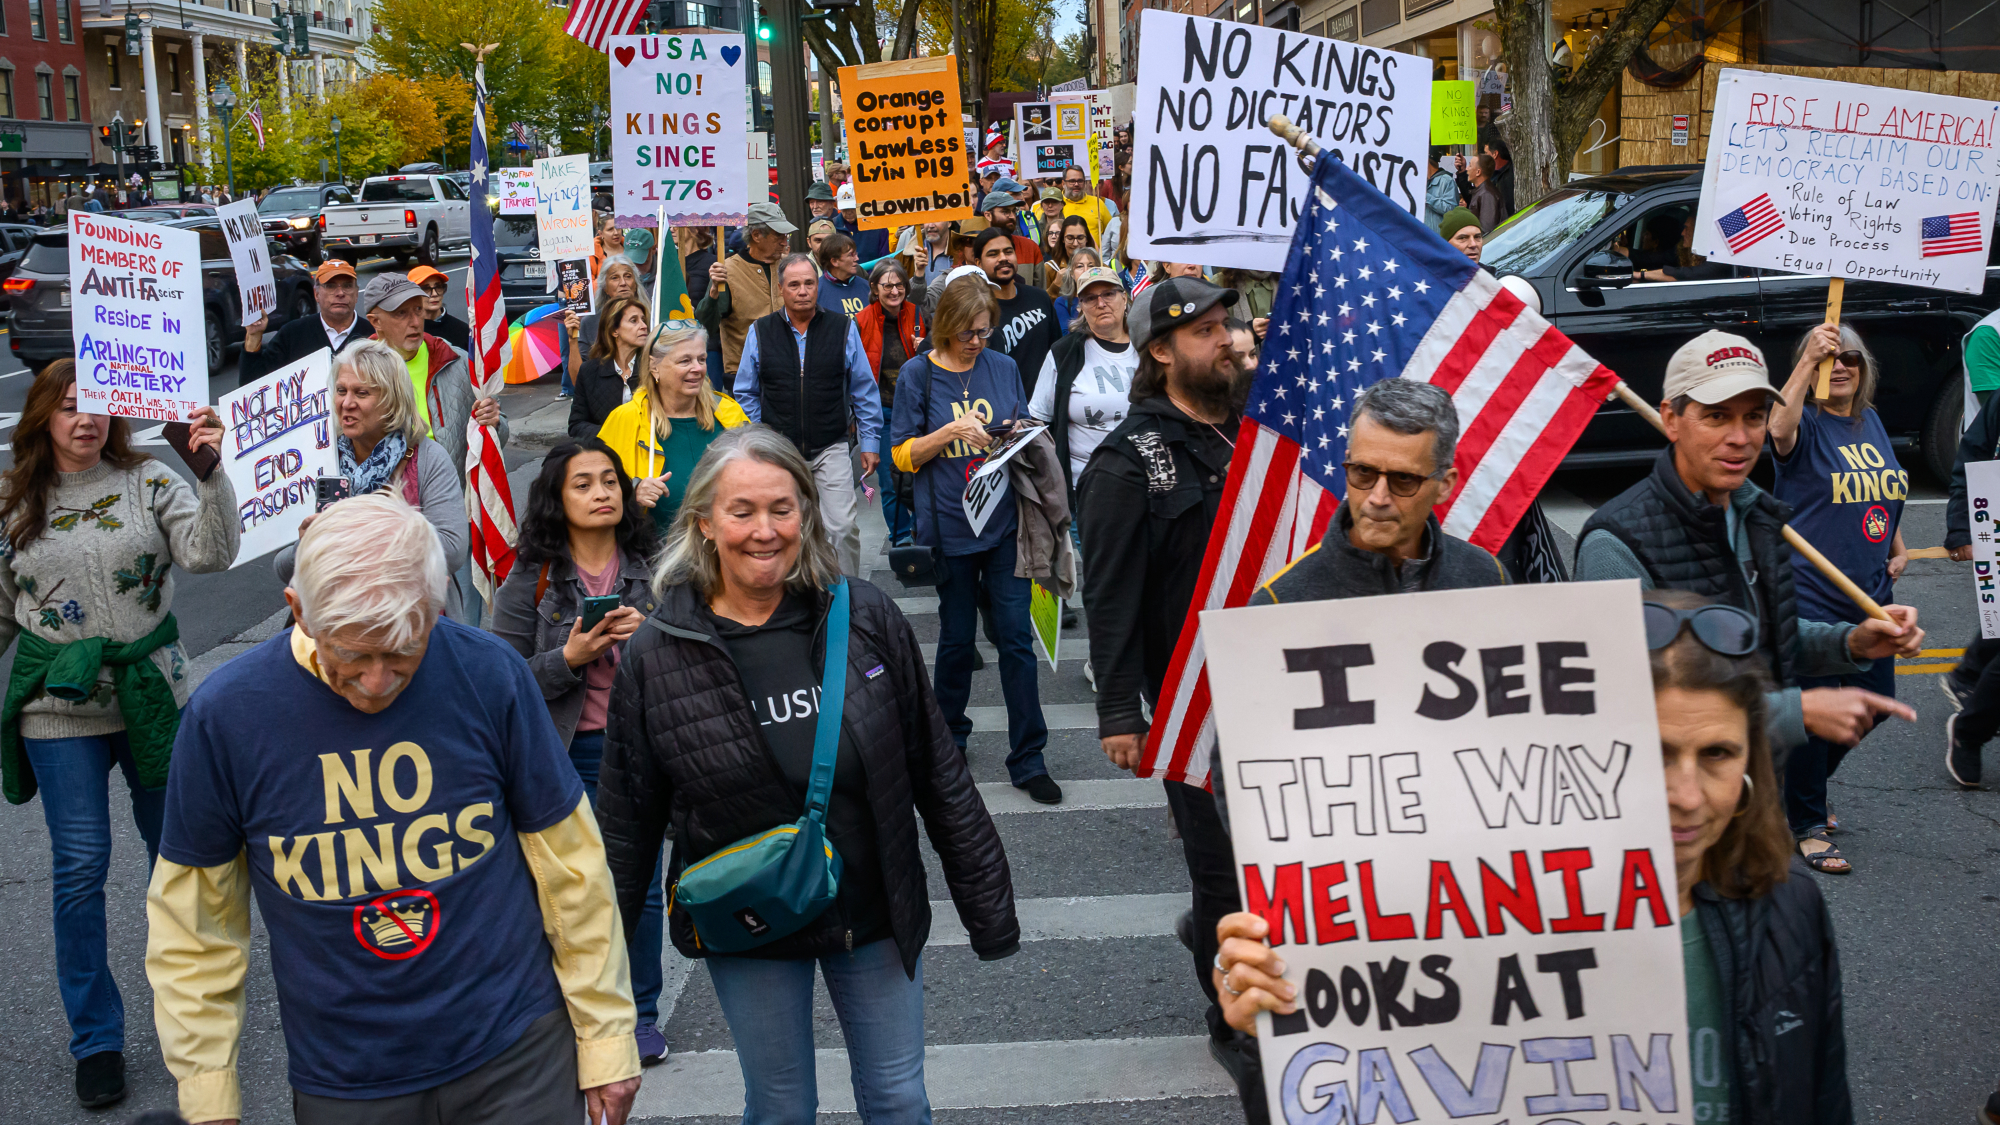 Millions turn out for anti-Trump ‘No Kings’ rallies
Speed Read An estimated 7 million people participated, 2 million more than at the first ‘No Kings’ protest in June
-
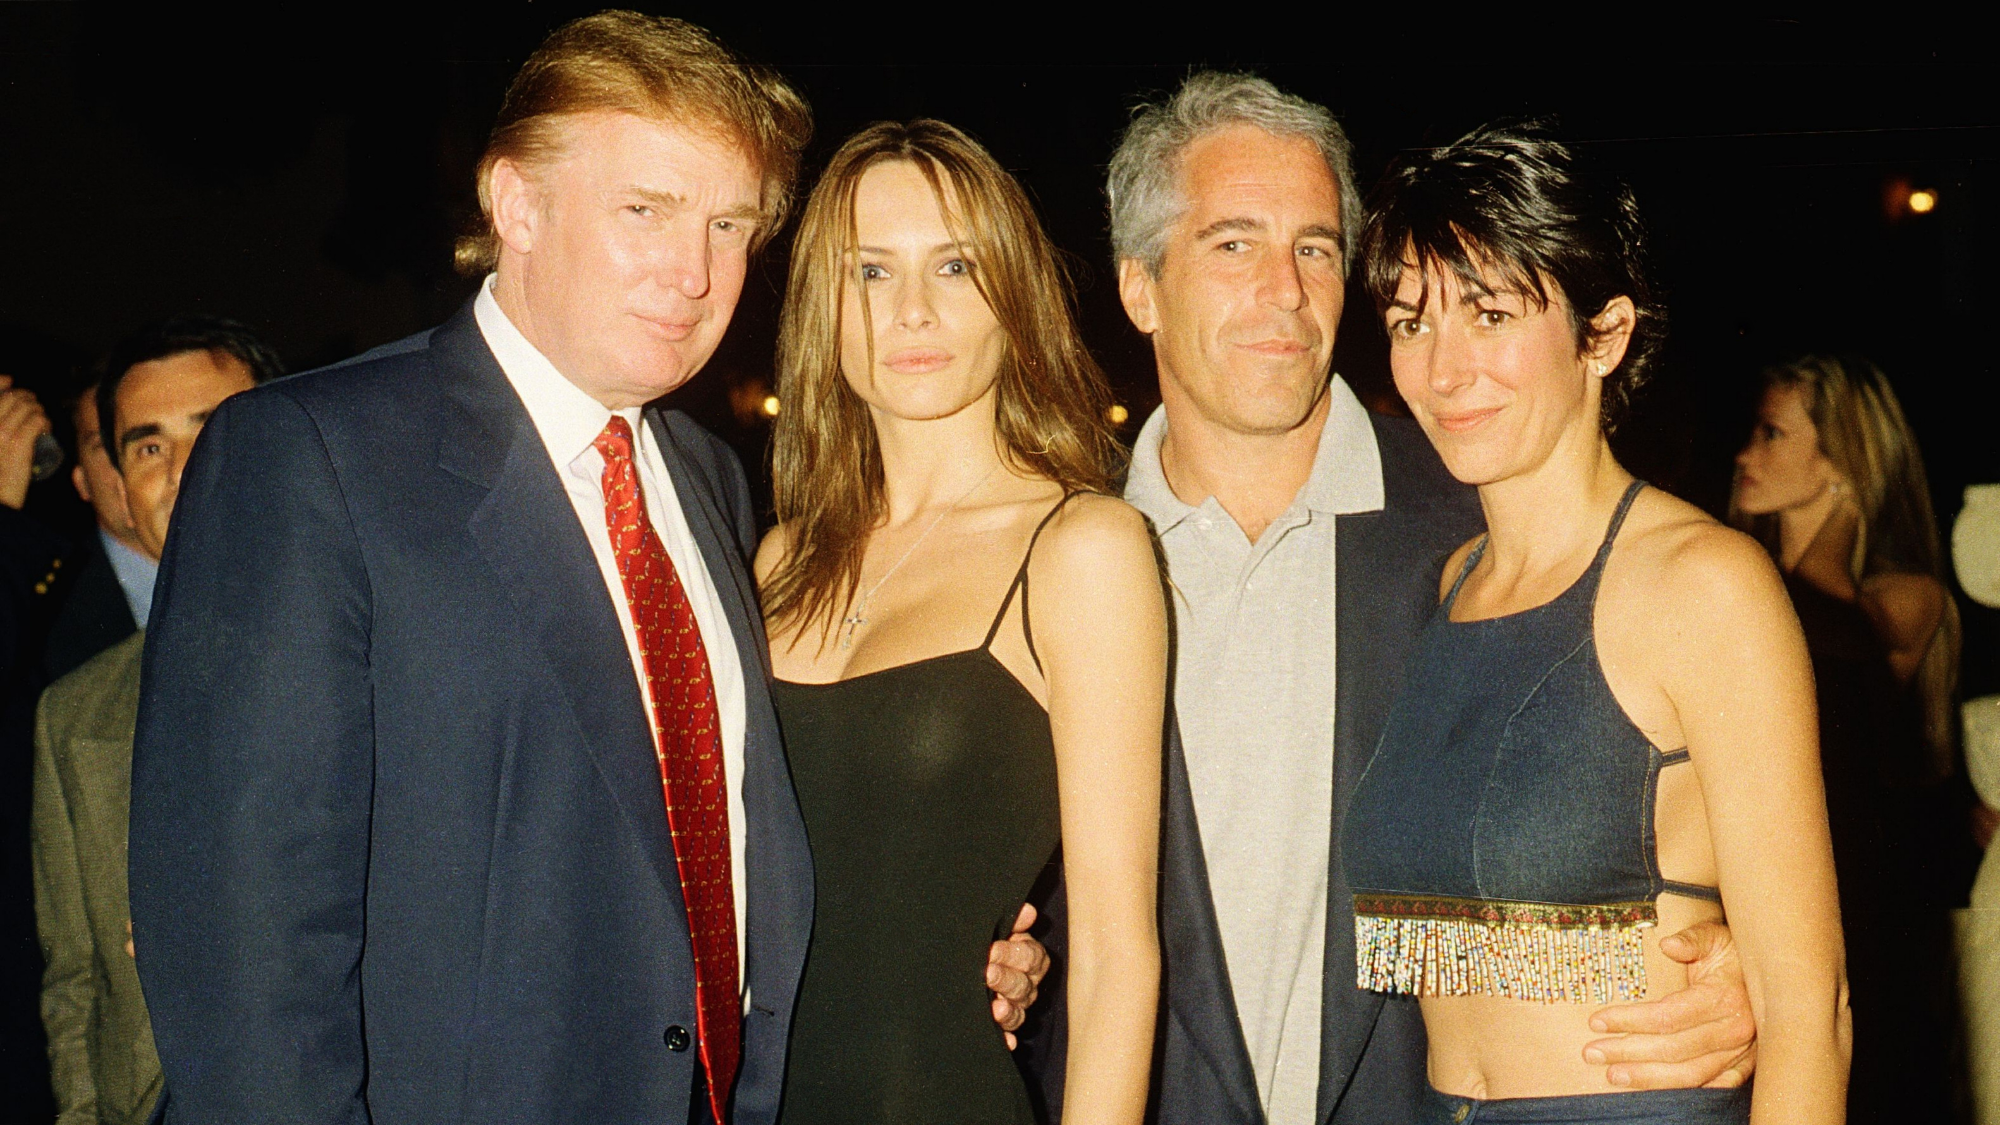 Ghislaine Maxwell: angling for a Trump pardon
Talking Point Convicted sex trafficker's testimony could shed new light on president's links to Jeffrey Epstein
-
 The last words and final moments of 40 presidents
The Explainer Some are eloquent quotes worthy of the holders of the highest office in the nation, and others... aren't
-
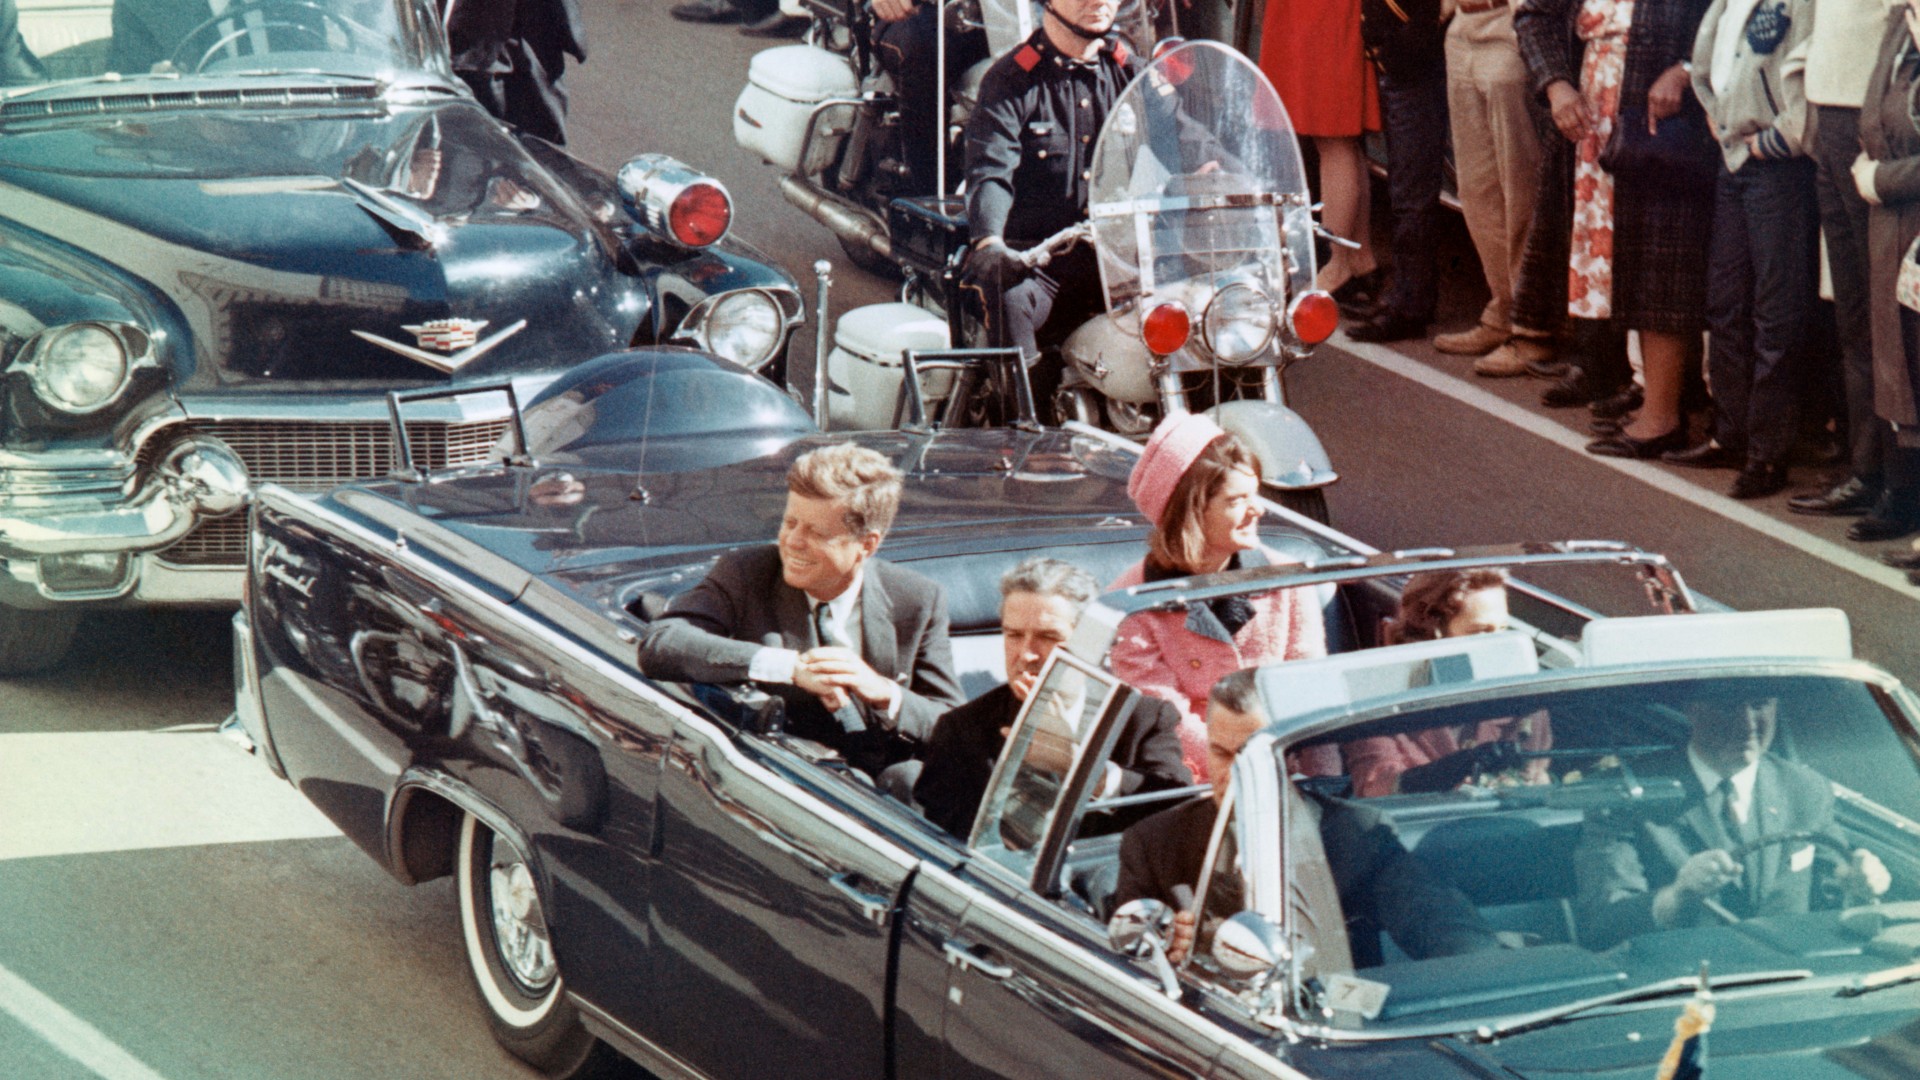 The JFK files: the truth at last?
In The Spotlight More than 64,000 previously classified documents relating the 1963 assassination of John F. Kennedy have been released by the Trump administration
-
 'Seriously, not literally': how should the world take Donald Trump?
Today's big question White House rhetoric and reality look likely to become increasingly blurred
-
 Will Trump's 'madman' strategy pay off?
Today's Big Question Incoming US president likes to seem unpredictable but, this time round, world leaders could be wise to his playbook
-
 Democrats vs. Republicans: who are US billionaires backing?
The Explainer Younger tech titans join 'boys' club throwing money and support' behind President Trump, while older plutocrats quietly rebuke new administration


